
You can usually spot the problem before the dashboard does. Reps are busy, the CRM is full, and yet the same deals keep sliding from one stage to the next while nobody can explain why the pipeline feels stuck. In too many teams, the bleeding neck is still manual research, generic outreach, and a calendar full of non-selling work that leaves little room for actual selling.
That's why sales velocity matters. It's not just a number for forecasting reviews, it's the cleanest way to see whether research effort, pipeline quality, and deal motion are turning into revenue speed, or just more activity. For multi-product teams, it also exposes the deeper problem that most explainers skip, whether the business needs better-fit accounts, larger deals, shorter cycles, or a different way to measure expansion.
The Slow Pipeline Problem Most Sales Teams Won't Admit
The worst pipelines don't look broken at first glance. They look busy, with enough meetings, enough opps, and enough activity in the CRM to keep leadership from panicking. Then you check the motion and realize the team is burning time on research, drafting generic cold emails, and chasing deals that keep stalling in the same stage.
That's the bleeding neck. If reps are spending most of their day on non-selling work, the issue isn't motivation, it's that the workflow is forcing them to do manual qualification, manual account research, and manual personalization before they even get to selling. Generic outreach makes it worse, because it gets ignored, which means more follow-up, more rework, and more sideways pipeline.
Practical rule: if a rep can't explain why a given account belongs in the pipeline, that account is probably stealing time from better-fit opportunities.
Sales velocity gives you one number that ties that mess together. It shows whether the team's research effort is producing enough qualified opportunities, whether those opportunities are worth enough, whether buyers are converting, and how long the business is waiting for revenue to land. In a weekly pipeline review, that number is more useful than a wall of stage counts because it tells you whether the machine is moving.
The value here isn't vanity. It's diagnosis. If velocity falls, the question isn't whether the team worked harder, it's which input got worse and which team owns it. That's the lens most pipeline dashboards never force, and it's the difference between reporting activity and managing revenue motion.
The Sales Velocity Formula Built for Real Teams
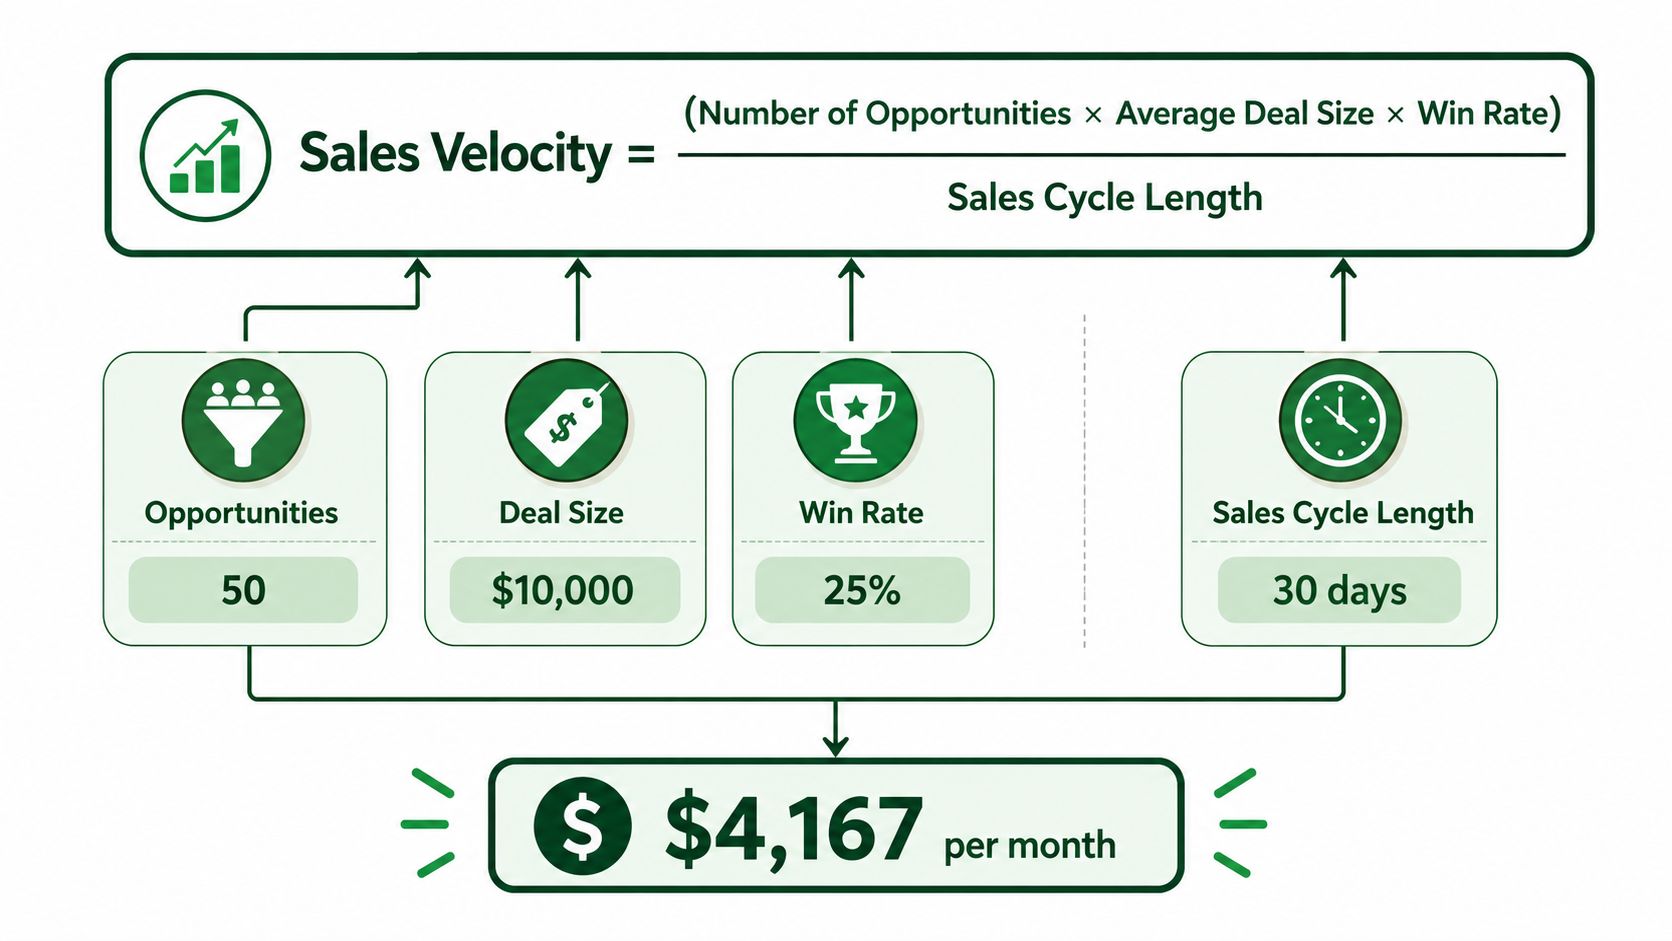
The formula is straightforward: number of opportunities × average deal size × win rate, divided by sales cycle length. The point isn't to memorize it, the point is to understand what each input controls. Opportunities tell you how much qualified pipeline you've got, deal size tells you how much each win is worth, win rate tells you how much of that pipeline closes, and cycle length tells you how long the business waits to collect the result.
A simple worked example makes this easier to use. If a team has 50 opportunities, an average deal size of $10,000, a 25% win rate, and a 30-day sales cycle, the formula produces $4,167 per month. That's the kind of number you can compare across segments, products, or account types without guessing which part of the funnel is carrying the load.
The important part is the multiplication. A small drop in one input can erase progress somewhere else because the formula doesn't treat the inputs independently. If your team adds more opportunities but those opps are lower quality, velocity can still flatten. If you raise deal size but the cycle gets longer, the gain may disappear before anyone sees it in revenue.
Practical rule: don't celebrate a single improved metric until you know which other input moved against it.
A lot of new RevOps hires make the same mistake, they treat the velocity number like a score instead of a system. They'll compare a weekly snapshot to a quarterly one and act surprised when the meaning changes, even though the time frame changes the way the number behaves. Weekly views are useful for spotting motion problems, monthly views are better for trend reading, and quarterly views are more useful for leadership planning. The math is the same, the operational meaning isn't.
For a deeper primer on pipeline reporting patterns, PitchSmart's blog is a useful place to keep nearby when you're rebuilding the math around real workflow, not theory.
Why Sales Velocity Is a Diagnostic Metric, Not a Target
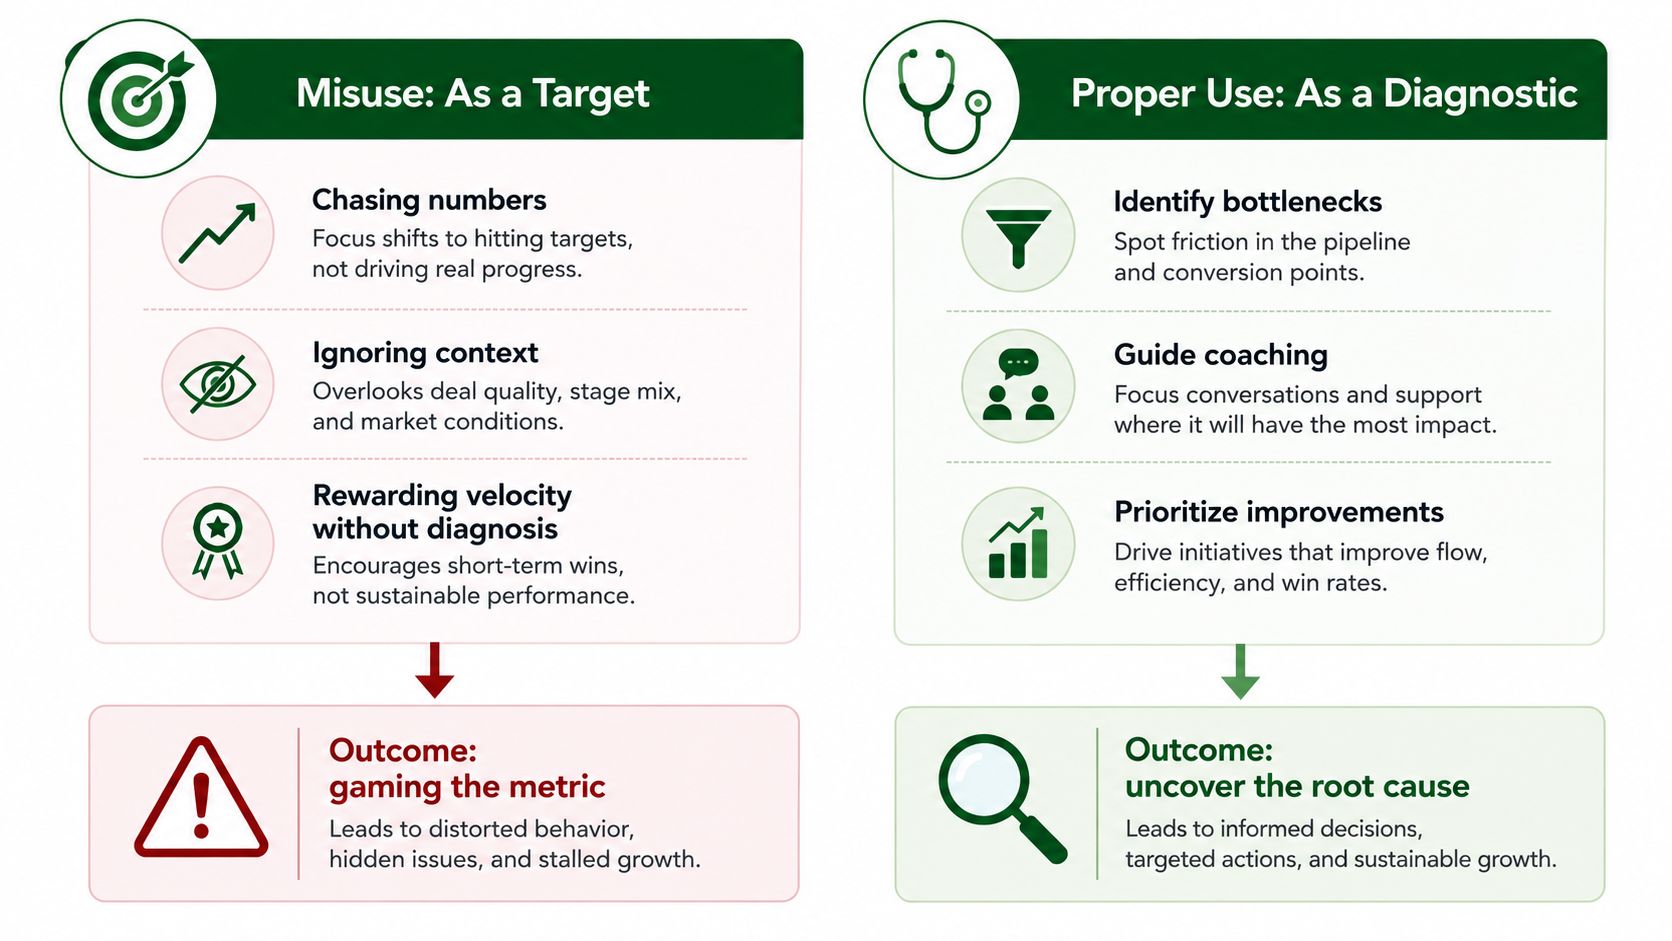
Treating velocity as a goal creates bad behavior fast. Reps start forcing deals forward, managers start asking for movement instead of clarity, and leadership ends up rewarding noise. That's how teams get a prettier dashboard and a worse forecast.
The better question is simple, which input changed and why. If opportunities fall, the issue sits with sourcing, qualification, or territory design. If deal size drops, you're looking at packaging, pricing, or product mix. If win rate slips, enablement and coaching are usually closer to the problem than forecast hygiene. If cycle length stretches, process design and handoffs deserve a hard look.
How to assign the work
Velocity gets useful when each input has an owner. Opportunities usually sit with SDR and BDR motion. Deal size is tied to product, packaging, and pricing choices. Win rate belongs with sales enablement, managers, and frontline coaching. Cycle length is where RevOps earns its keep, because process design can add days everywhere.
That ownership matters more in mixed pipelines than in a clean single-product org. One segment can be moving faster while another is dragging the average down, which is exactly why you shouldn't average everything together and call it insight. Attribute changes by segment, by product, and by account type, then decide whether the fix is better-fit accounts, shorter cycles, or larger deals.
Velocity is only honest when it's broken apart far enough to show where the drag lives.
The decision framework is practical. If the team is chasing too many bad-fit accounts, fix opportunity quality first. If buyers are already converting and the deals are too small, work deal size through packaging or bundle design. If the pipeline is healthy but slow, attack cycle length. If the right accounts keep losing late, win rate is the first lever to pull.
How to Redefine Velocity for Multi-Product and Expansion
Most sales velocity explainers assume one pipeline, one average deal size, and one buying motion. That's fine for a single-product team. It falls apart in a multi-product org where expansion revenue, cross-sell paths, and product fit all behave differently.
Match the level to the motion
You can measure velocity at the opportunity level when the selling motion is discrete and the deal structure is clean. Use the account level when the question is how much revenue an existing customer can absorb across solutions. Use the product-line level when one catalog item has a different fit signal or buying path from another. Those are not interchangeable views, and forcing them into one average hides the signal you need.
Here's the clean comparison:
| Velocity Input | Net-New Motion | Expansion Motion |
|---|---|---|
| Opportunities | Qualified new-logo opps | Existing-account opportunities by solution |
| Deal Size | Average new deal value | Average expansion value per product or bundle |
| Win Rate | Close rate on new pipeline | Close rate on account-based expansion motions |
| Cycle Length | First contact to closed-won | Expansion trigger to closed-won |
A practical example helps. A customer may already be using one product, but only one adjacent solution has a real buying signal. In that case, measuring velocity across the whole account can blur the result, because the wrong product inflates the average and the wrong motion stretches the cycle. Measuring the expansion motion per solution gives you a truer read on where the portfolio is moving.
PitchSmart fits naturally as one option for teams that want account research built around what they sell. It researches accounts against defined products and signals, then turns that into per-account cross-sell actions and outreach inputs for the right solution, which is far more useful than a generic firmographic view when the goal is expansion.
The point isn't to invent a new formula. It's to make the formula match the motion you're trying to manage. If the business cares about cross-sell, velocity has to reflect cross-sell behavior, not borrowed assumptions from net-new acquisition.
The Four Levers That Actually Move Sales Velocity
The fastest way to improve velocity is to stop treating all four inputs like abstract math and start treating them like workflows. Each lever maps to a day-to-day job that an SDR, BDR, RevOps lead, or enablement manager can influence this week.
More qualified opportunities
Bulk, customizable lead research with proprietary data points matters. If reps are wasting time on weak accounts, the first fix is better qualification before outreach, not more outreach volume. A cleaner list raises the quality of the opportunity count without dragging the team into a bigger manual research pile.
Larger deal size
Deal size improves when segmentation gets sharper. Advanced list segmentation based on buying signals helps teams separate accounts that can buy a single product from accounts that are likely to buy a bundle, expansion, or higher-fit package. That's how you stop leaving money on the table by treating every account like the same size.
Higher win rate
Win rate goes up when the first touch sounds like it was built for the account, not borrowed from a template. Activity-based conversational hooks drawn from recent online signals give reps a reason to open on something specific, which is usually better than a generic pain-point guess. From there, automated 3-step email and LinkedIn sequences seeded from the best hooks keep the conversation consistent without forcing reps to rewrite the same message ten times a day.
Shorter cycle length
Cycle length shrinks when follow-up is relevant and fast. If the first message lands with context, the discovery call starts better, and the buyer wastes less time explaining the basics. That's where research quality shows up in the calendar, because better inputs reduce back-and-forth.
For teams pricing this work against the manual hours it replaces, PitchSmart's pricing page is the right place to inspect the trade-off without guessing.
The weekly playbook is blunt. Build better-fit lists first, attach buying signals to each account, seed the opening message from a real trigger, and let the sequence carry the follow-up. That won't fix every pipeline issue, but it will move the parts of velocity that reps can control.
Common Pitfalls That Make Velocity Numbers Misleading
The most dangerous velocity reports are the cleanest ones. They present one neat average and hide all the context that made the number move. Once that happens, leadership starts arguing about the metric instead of fixing the pipeline.
What to avoid
- Averaging unlike segments: Net-new enterprise, expansion, and SMB motions shouldn't sit in the same bucket if the buying path is different.
- Counting recycled opportunities: A reopened opp isn't the same as fresh pipeline, and including it muddies the signal.
- Ignoring stage slippage: A deal that keeps sliding forward and backward can make the pipeline look alive while nothing is moving.
- Benchmarking without deal size context: A velocity number with tiny deals doesn't compare cleanly to one with large deals.
Cross-team comparisons create political pressure when the underlying motions differ. A team with a shorter sales cycle can look better than a team selling into larger, slower accounts, even if the slower team is doing the harder work. That's not insight, it's a bad incentive system.
The same problem shows up when leaders ask for one number across all products. The average may look stable while one product line is carrying expansion and another is clogging the queue. If you want useful reporting, compare like with like, then add the context that explains why the number moved.
Practical rule: if a velocity dashboard can't tell you which motion changed, it's only half a report.
A good leadership review should end with three things, where the change happened, which team owns the input, and what gets tested next. Anything else is just commentary.
Monitoring Sales Velocity So It Stays Honest
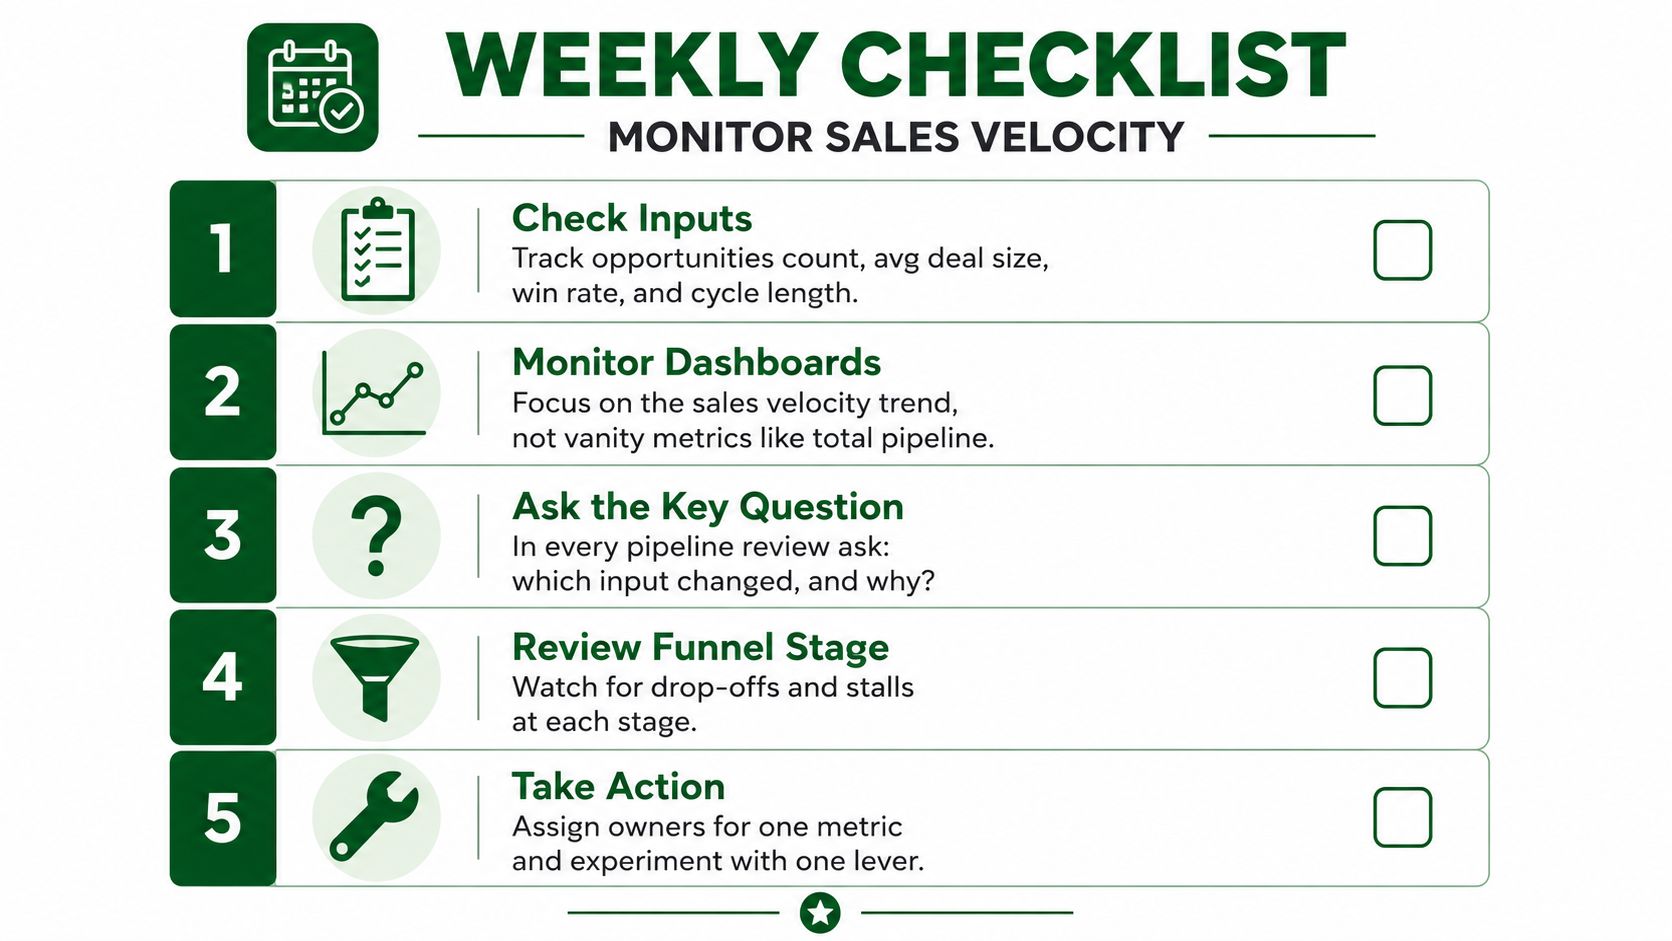
A velocity review goes sideways fast when teams stare at the total and ignore the inputs. Start with the four drivers, then separate the numbers by motion. In every pipeline review, ask one question, which input changed, and which team owns it.
The target only matters after you tie it to the right segment. New-logo velocity and expansion velocity should not be held to the same expectation, because the deal sizes, cycle lengths, and win rates do not behave the same way. Track the segment that matters, then measure that motion on its own terms.
Weekly checklist
- Check inputs. Count opportunities, average deal size, win rate, and cycle length.
- Monitor the trend. Look at velocity movement, not vanity totals.
- Ask the key question. Identify which input changed and why.
- Review funnel stage. Watch where deals stall or slip.
- Take action. Assign one owner and test one lever.
The point is to keep the metric honest, not to worship a single score. If one input moves, velocity should explain whether the change came from more deals, better conversion, larger deal size, or a shorter cycle. If the number does not shift after a workflow change, the process did not change enough to matter.
Start with one input and run one experiment for 30 days. If the change is real, the velocity movement will show it. If it is not, the answer is to change the workflow, not the metric.
If you are rebuilding pipeline reporting after an acquisition, schedule a PitchSmart demo to see how account research, sequencing, and segment-level velocity can be tracked in one workflow without forcing every motion through the same pipeline view.