You hit the revenue number. The board is satisfied. Finance closes the quarter. Then the planning call starts, and the underlying problem shows up.
Nobody can say what drove the result. Did the team win because pricing held? Because reps pushed more deals through? Because customers bought a better product mix? Or because the quarter got padded with lower-value business that will be hard to repeat?
That uncertainty creates bad outbound behavior fast. Sales managers can't tell SDRs which accounts deserve the most attention. AEs chase whatever responds. Reps fall back to manual research and generic messaging because the business hasn't translated revenue data into targeting rules. That gets expensive in time and pipeline quality. According to Salesforce's 2025 State of Sales report, sales reps spend only 28–30% of their week on direct selling activities, meaning the remaining 70–72% is consumed by non-selling tasks such as research, account prep, CRM updates, data entry, and internal meetings (Salesforce 2025 State of Sales reference).
If revenue analysis doesn't tell the field what to do next, it isn't finished. Teams need a way to turn hindsight into account selection, message angles, and sequencing priorities. That's where price mix volume analysis becomes useful for RevOps and sales, not just FP&A. For teams trying to connect financial signals to better prospecting discipline, tools like PitchSmart matter because they help operationalize that direction instead of leaving it in a spreadsheet.
Price volume mix analysis in one minute
Price volume mix analysis, usually shortened to PVM analysis, splits a revenue change between two periods into three effects that add back to the total. Price is what you charged, volume is how much you sold, and mix is what buyers chose.
- Price effect = (current price minus previous price) × current quantity
- Volume effect = (current quantity minus previous quantity) × previous price
- Mix effect = the remainder that closes the gap to the total revenue variance
The three have to tie back to the total change. When they do not, the data grain or the formulas are wrong, and the read is not ready to present. A two factor price volume analysis stops at price and volume, which is enough for one product at one price and misleading for a portfolio. What follows is the full formula set, a worked SaaS example, and the account action each result points to.
Why Your Revenue Number Is Lying to You
A revenue number without decomposition is only half a metric. It tells you the outcome, not the mechanism.
That matters most when a VP of Sales walks into quarter planning with a win on paper but no clean explanation behind it. If the team can't separate gains from price, volume, or mix, they can't decide whether to push premium positioning, widen the top of funnel, or tighten qualification around better-fit accounts.

Why a top-line number hides the real story
A lot of teams celebrate growth that isn't durable. They assume a bigger top line means the go-to-market motion is working, when the result may have come from one-time discount changes, a temporary spike in lower-tier volume, or a favorable product mix that the team didn't intentionally create.
That blindness spreads downstream. RevOps can't build intelligent territory rules. SDR leaders can't tell reps where premium demand is most likely to exist. Messaging gets generic because account prioritization is generic.
Practical rule: If you can't explain revenue movement in operational terms, the sales team will improvise, and improvised outbound usually means broad lists, weak hooks, and wasted touches.
A coffee shop example that makes PVM click
Think about a coffee shop. Revenue can change because the shop raised prices, because it sold more cups, or because more buyers chose larger drinks and specialty items instead of plain coffee. The top-line increase looks the same at first glance, but the next action is completely different depending on the driver.
B2B SaaS works the same way. If growth came from price, the lesson might be that the market tolerated stronger packaging or better negotiation discipline. If it came from volume, pipeline generation likely did the heavy lifting. If it came from mix, the team sold a healthier combination of products, plans, or customer segments.
For sales teams, that's the difference between targeted execution and random activity. A rep who knows the business needs more high-fit enterprise opportunities works differently from a rep who gets told to "book more meetings."
Deconstructing Revenue with PVM Analysis
Price mix volume analysis gives sales and finance a shared language for revenue change. Instead of arguing from anecdotes, the team can break movement into a small set of drivers and tie those drivers back to commercial decisions.
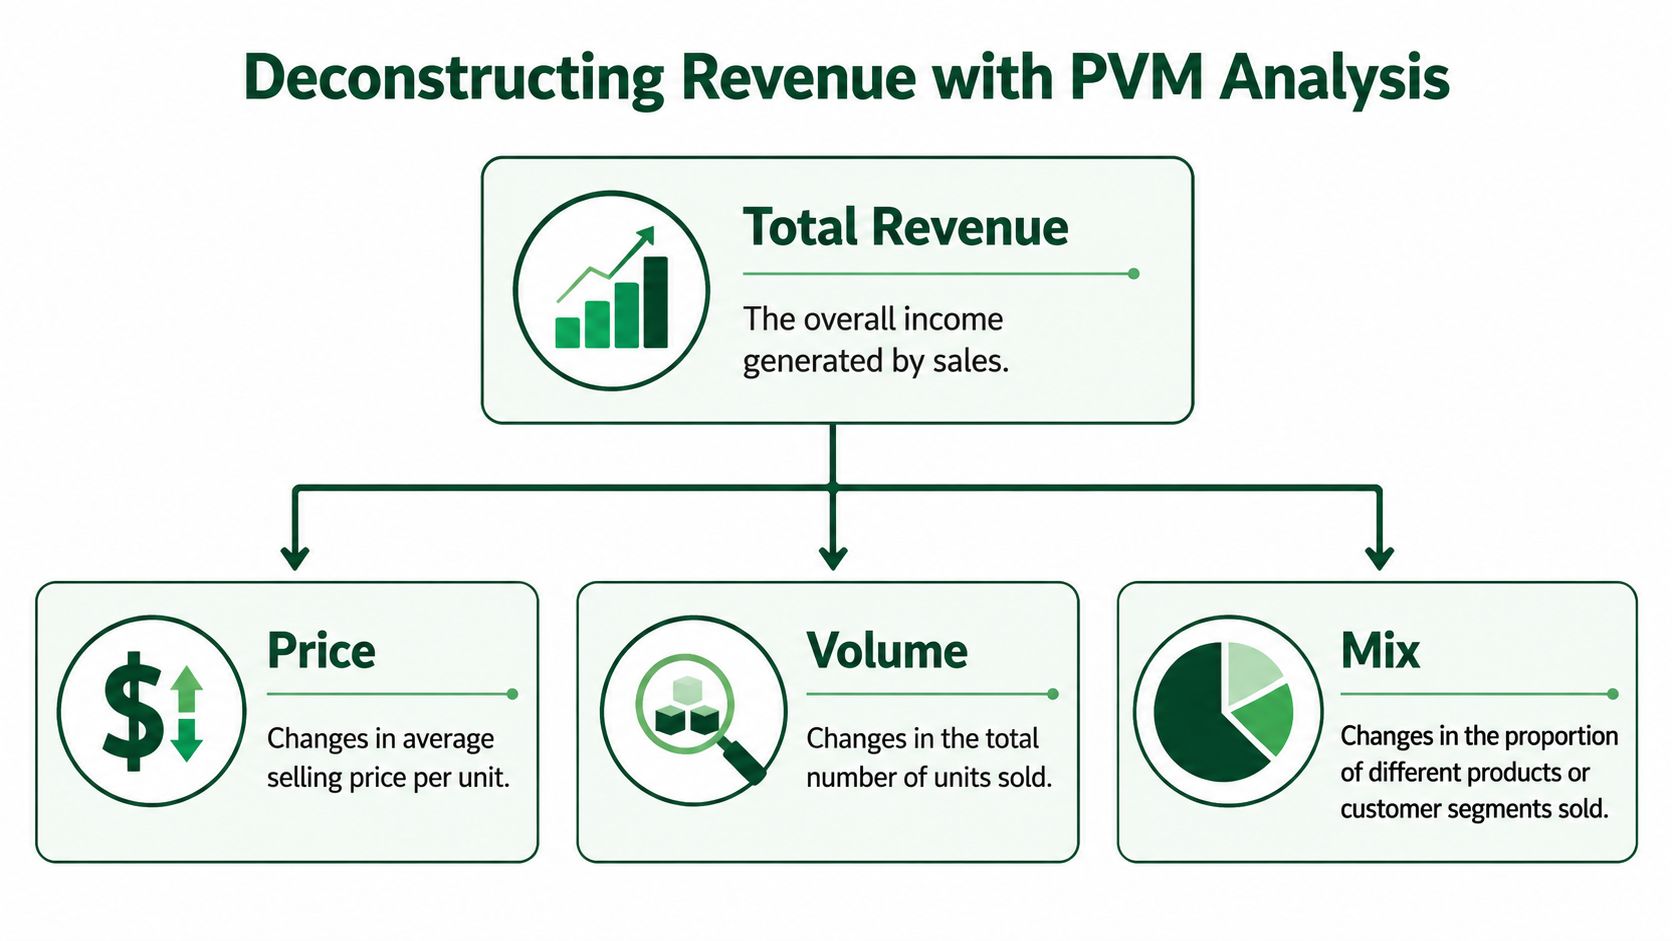
The core definition is straightforward. PVM analysis splits total revenue changes into three primary elements: the price effect, volume effect, and mix effect, which together form the branches of a Revenue Variance Tree used to visualize financial performance. The price effect quantifies how price changes impact revenue, while the volume effect isolates sales volume changes, and the mix effect examines how the combination of different products sold influences revenue (Revenue Variance Tree explanation).
What each of the three effects answers
Each effect answers a different business question.
- Price effect asks whether the business made more or less because it charged a different amount.
- Volume effect asks whether more or fewer units, seats, contracts, or subscriptions were sold.
- Mix effect asks whether buyers chose a different blend of offerings, segments, or plans.
That third one is the piece sales teams often miss. You can grow revenue while making your future harder if growth comes from too much low-value business. Mix exposes that. It shows whether the portfolio shifted in a direction you want.
Here's a useful mental model for non-finance teams:
| Driver | Plain-English question | Sales implication |
|---|---|---|
| Price | Did we charge more or less? | Review positioning, discount control, packaging |
| Volume | Did we sell more or fewer units? | Review prospecting coverage and conversion flow |
| Mix | Did customers buy a better or worse blend? | Review segment focus and product targeting |
A short walkthrough helps make it concrete.
The coffee shop, one driver at a time
Go back to the coffee shop. If the owner sold the same drinks but raised menu prices, that's price. If foot traffic increased and more cups sold at the old menu, that's volume. If regular coffee sales fell while specialty drinks grew, that's mix.
The point isn't the math first. The point is interpretation. Price mix volume analysis keeps teams from treating every revenue increase as proof that every part of the commercial engine worked.
Revenue growth isn't a strategy by itself. Sales leaders need to know which lever moved before they tell the field where to focus.
The Math Behind Price Mix and Volume
The formulas matter because they stop teams from arguing over interpretations. Once everyone uses the same logic, finance, RevOps, and sales can work from the same score.
The cleanest version uses three effects and checks that they add back to total revenue variance. That's not a nice-to-have. It's the control that tells you your decomposition is valid.
The three formulas that matter
The standard definitions are specific. The Price Effect in PVM analysis is rigorously defined as (Current Price − Previous Price) × Current Quantity. The Volume Effect must be calculated as (Current Quantity − Previous Quantity) × Previous Price to avoid conflating volume growth with price inflation. When all three effects are summed, Price + Volume + Mix, they must precisely tie-out to the total revenue variance, serving as a mandatory validation step (PVM formula reference).
Use those formulas for a reason:
- Price uses current quantity so you measure the impact of the actual units sold at the new price.
- Volume uses previous price so quantity movement doesn't get mixed up with pricing movement.
- Mix closes the gap between total change and the other effects, assuming the model is structured correctly.
If your team wants to operationalize these insights across product lines and segments, it helps to think about which motions deserve more resources before budget season starts. That's often the difference between adding headcount blindly and matching effort to economics. Teams comparing tools and cost trade-offs can review PitchSmart pricing separately, but the analysis itself should come first.
What data you actually need
You don't need a giant BI rebuild to start. You do need clean period-over-period inputs.
At minimum, gather:
- Previous period quantity
- Current period quantity
- Previous period price
- Current period price
- Product or plan-level detail so mix can be observed instead of guessed
Without product-level detail, teams usually collapse everything into averages. That can still show directional movement, but it weakens your ability to act on the result.
A simple two-product illustration
Here's a compact way to consider this:
| Product | Previous price | Current price | Previous quantity | Current quantity |
|---|---|---|---|---|
| Product A | P₁ | P₂ | Q₁ | Q₂ |
| Product B | P₁ | P₂ | Q₁ | Q₂ |
For each product, calculate the price effect and volume effect directly from the formulas above. Then compare the sum of those effects to the total revenue change. The remaining piece is the mix effect.
Operator's check: If the parts don't tie back to the total change, don't present the analysis yet. Something in the grain, formulas, or source data is off.
That tie-out discipline is what makes price mix volume analysis useful. It turns a messy revenue conversation into a repeatable operating review.
A Worked Example with a SaaS Business
A SaaS example is where this gets practical for sales. Think of a company with three plans: Starter, Pro, and Enterprise. Q1 to Q2 revenue went up, but leadership wants to know whether that growth came from charging more, closing more logos, or selling a better plan mix.
You don't need exact currency figures to understand the output. What matters is how the pattern reads.
What changed between the two periods
Suppose the team made three moves at once. Enterprise pricing improved. Overall unit count also changed. But the sales mix shifted toward Starter deals because the SDR team targeted easier-to-book accounts and AEs accepted lower-fit opportunities to protect headline pipeline.
That produces a familiar commercial story. The business may show a positive price effect and some help from volume, while the mix effect drags because too much of the quarter came from lower-value plans.
A properly built PVM model captures that. In a properly structured Price Volume Mix (PVM) analysis, the Mix Effect is calculated by multiplying the Mix-weighted volume differential by the price differential relative to the total base average price. Empirical benchmarks show that for multi-product businesses, the mix effect can account for 15–30% of total revenue variance (mix effect benchmark and method).
That benchmark matters because it tells RevOps not to dismiss mix as a minor adjustment. In multi-product businesses, mix can materially reshape the story.
How to read the result like an operator
Here's the kind of narrative an experienced sales leader should pull from the analysis:
- If price is positive and mix is negative, the team may have pricing power but weak targeting discipline.
- If volume is positive and mix is negative, pipeline generation is working, but qualification or product alignment is off.
- If mix is positive even with flat volume, the team may be getting sharper about where it sells and what it sells.
For SaaS, that last point is often the best sign. It means the field isn't just closing business. It's closing the right business.
Consider the outbound implication. If Starter wins are crowding out Enterprise opportunities, the answer isn't "send more emails." The answer is to change who gets targeted, what trigger signals matter, and how reps frame value in the first message.
A good PVM read turns into a sales instruction. "Sell more Enterprise into accounts showing operational complexity" is useful. "Grow revenue next quarter" isn't.
That shift in interpretation is where finance analysis starts becoming a go-to-market asset.
Turn PVM Insights into an Outbound Playbook
Teams frequently stop too early. They finish the analysis, nod at the slide, and move on. Then the SDR team goes back to broad lists, manual account research, and email copy that could apply to anyone.
That's the execution gap. The report says the company needs a healthier mix. The field still works the same way.

Translate financial insight into account strategy
Let's stay with the SaaS example. Your PVM work says too much recent growth came from lower-value plans. That gives RevOps a specific mandate: improve mix by increasing the share of accounts likely to need Pro or Enterprise.
That instruction should change four things in outbound:
List design
Stop treating the TAM as one pool. Segment accounts by signs that they have the complexity, scale, or urgency that aligns with the higher-value offer.Research priorities
Reps shouldn't waste time reading every website from scratch. Research should focus on signals that map to the product tier you're trying to sell.Hook selection
A high-mix motion needs sharper openers. Generic "saw your company is growing" messaging won't move a strategic buyer.Sequence construction
The sequence should reflect the signal. A buyer showing hiring activity, product launches, or operational change deserves a different angle from a cold list with no context.
That's where automation starts paying off. If the business decision is "increase better-fit outbound coverage," the operational requirement becomes obvious.
Build outreach around the right mix motion
A practical workflow looks like this:
Start with the revenue signal
PVM tells you which customer and product combinations are worth more strategic effort.Build a target segment around that signal
RevOps defines the account list using the characteristics most associated with the desired mix outcome.Research the list in bulk
Instead of assigning reps one-by-one account prep, use a system that can scan the whole list for proprietary data points and recent online activity.Turn signals into hooks
The best outbound messages usually begin with something specific that happened at the account. Activity-based conversational hooks are more useful than generic personalization.Launch multi-step outreach
Good teams don't leave that context trapped in notes. They seed it into automated 3-step email and LinkedIn sequences so reps can execute consistently.Refine segmentation
As replies and meetings come in, tighten the list around the buying signals that correlate with the higher-value offer.
This is the missing bridge between finance and outbound. Price mix volume analysis tells you where the business should lean. The outbound engine determines whether the field can do it.
For teams building that bridge, it helps to study examples of signal-based prospecting and outbound operations in the PitchSmart blog. The important principle is broader than any one tool. Better segmentation, better hooks, and better sequencing are what turn a mix problem into a pipeline plan.
Common PVM Analysis Pitfalls to Avoid
Most bad PVM work doesn't fail because the formulas are hard. It fails because the data grain is wrong, the time periods aren't comparable, or the team treats decomposition like proof of causation.
Aggregation can break your mix signal
This is the mistake that erodes strategic decisions. A frequently ignored issue is how blending SKUs with divergent margins distorts the 'mix' calculation. When analysts group products without isolating SKU-level Average Selling Price (ASP), they inadvertently blend 'price mix' into the price data, rendering the mix effect unreliable for margin optimization. This leads to flawed strategic initiatives (SKU-level mix caution).
In plain terms, if you lump unlike products together, the model may tell you price moved when mix really moved, or vice versa. For RevOps, that can lead to the wrong targeting decision.
A few practical consequences:
- Comp plans get skewed when teams reward the wrong behavior.
- Segment strategy drifts because leadership thinks pricing improved when the portfolio shifted.
- Outbound focus gets diluted because account selection isn't anchored to the true economic driver.
PVM tells you what moved, not why it moved
PVM is decomposition, not diagnosis. It identifies the bucket where change happened. It doesn't prove the root cause behind the bucket.
A positive price effect might reflect stronger negotiation, a packaging change, or lower discounting. A negative mix effect might reflect poor qualification, market demand, channel shift, or rep behavior. You still need operator judgment.
Don't hand a sales team a PVM chart and call it strategy. Pair it with call reviews, win-loss notes, segment data, and pipeline inspection.
Time periods and data hygiene matter more than most teams think
The cleanest PVM analyses compare like with like. If one period includes a product launch, territory redesign, or major reporting change and the other doesn't, interpretation gets messy fast.
Use a short checklist before you trust the output:
| Check | Why it matters |
|---|---|
| Same time basis | Prevents seasonality from distorting the signal |
| Consistent product mapping | Avoids false mix changes from category shifts |
| Stable pricing definitions | Keeps discount behavior from being misread |
| Reliable item-level data | Protects the mix calculation from aggregation noise |
A disciplined model is still useful with imperfect data. But teams should be honest about what the analysis can support. If SKU history is missing, say so. If the grain forces you to combine price and mix interpretation, say that too.
Price volume analysis vs price volume mix analysis
The two names get used as if they meant the same thing. Price volume analysis explains a revenue change with two effects, price and volume. It is fast, it is fine for a single product at a single price point, and it drops the question a multi product business most needs answered.
Mix is the effect that says what customers chose: which plan, which segment, which product. That is the number a go to market team can act on, which is why a portfolio business should run the three factor version even when the two factor version is easier to assemble from the data it already has.
The same logic applies one level down, at the account. Revenue that moved because a segment bought a different blend is a targeting question, and the accounts that have not bought that blend yet are the ones a rep should work next. Account whitespace analysis maps those gaps, and account mapping turns one of them into a plan for a named account.
From Reactive Reporting to Predictable Growth
The primary value of price mix volume analysis isn't the chart. It's the operating clarity that follows.
When finance, RevOps, and sales can agree on whether revenue moved because of price, volume, or mix, planning gets sharper. Territory choices improve. Qualification improves. Outbound stops being a volume game and starts becoming a targeting game.
That's the shift from reactive reporting to predictable execution. You stop asking reps to prospect harder in every direction. You give them a defined motion based on what the business actually needs more of.
The teams that do this well treat financial analysis and outbound execution as one system. The report identifies the better revenue shape. The field then builds lists, hooks, and sequences designed to create more of it. That's how a backward-looking analysis starts influencing future pipeline instead of dying in a QBR deck.
If your team is still doing account research one tab at a time, you're leaving the hardest part of outbound to manual effort. PitchSmart helps sales teams upload their own lists, run bulk research across every account, pull activity-based hooks from recent signals, segment by buying indicators, and turn those insights into automated email and LinkedIn sequences. If you already know what kind of revenue mix you need, PitchSmart helps the team execute on it with far less guesswork.