A sales capacity plan is a spreadsheet that answers one question for the board: with the people we have and the people we plan to hire, can we hit the number? Most plans answer it with the same handful of inputs: headcount, quota, attainment, ramp and attrition. Every one of those inputs gets measured, argued over and revised each quarter.
There is one input almost no plan writes down, and it quietly sets the ceiling on all the others. It is how many accounts a rep can research well enough, per week, to earn a first conversation. The model assumes that number exists and is large enough. When it is smaller than the model needs, the plan misses, and the post-mortem blames attainment, ramp or hiring, because those are the only rows on the sheet.
This piece walks through where that assumption hides inside a standard capacity model, what happens when it is wrong, and how to add it as an explicit row you can measure and manage.
What a standard capacity model contains
Strip away the formatting and nearly every capacity model is some version of reps multiplied by quota multiplied by expected attainment, adjusted for the months new hires spend ramping and the reps you expect to lose. Outreach's overview of five sales capacity planning models lays out the common variants: top-down (revenue target divided by quota gives headcount), bottom-up (sum of territory forecasts), territory-based (accounts divided by available rep hours), workload-based (total hours multiplied by the share of time spent selling), and hybrids of the above.
Pigment's step-by-step guide to sales capacity planning uses a similar list of inputs:
- Team structure and the experience mix of the reps
- Historical quota attainment and win rates
- Sales cycle length
- Productivity per rep, measured as ARR or ACV
- Ramp time for new hires
- Attrition
These are sensible inputs and they are all outcomes you can pull from the CRM. None of them describes the work a rep does before an opportunity exists. Win rate starts counting at the opportunity. Sales cycle length starts counting at the opportunity. Attainment is the end of the chain. The part of the job that produces opportunities in the first place sits outside the model, folded into a single assumption that the historical conversion rates will hold.
The hidden throughput assumption
Run a quota backward through the funnel and the missing row shows up. Take an illustrative account executive with a $900,000 annual quota and a $30,000 average deal. The numbers below are assumptions for the example, not benchmarks. Substitute your own.
| Step | Assumption | Required per year |
|---|---|---|
| Closed deals | $900,000 quota at $30,000 per deal | 30 |
| Qualified opportunities | 1 in 4 opportunities closes | 120 |
| First meetings | 2 in 5 meetings become opportunities | 300 |
| Accounts researched and approached | 15 in 100 researched accounts take a first meeting | 2,000 |
The last row is the one nobody puts in the plan. Two thousand accounts a year, across roughly 46 working weeks, is about 43 accounts a week, or close to 9 a day. If researching an account properly (reading the recent news, the filings or hiring page, the tech stack, finding the reason this account needs what you sell now) takes 15 minutes, that is a little over two hours of research every working day.
Now set that against the time a rep actually has. Salesforce's research, surveying 7,775 sales professionals, found that reps spend just 28% of their week actually selling, with most of the rest going to deal management, data entry and other tasks. The more recent State of Sales statistics put non-selling work at 60% of a rep's time. On an eight-hour day, 28% is about two and a quarter hours. In this example, account research alone would consume roughly the whole of the measured selling time, before a single call, demo or proposal.
That is the throughput assumption the model makes without saying so. The conversion rate in the third row was measured on accounts that were researched. The plan assumes the rep has the hours to keep researching at that depth, at that volume, all year.
Why the workload model does not catch it
A workload-based model looks as if it should catch this, since it starts from hours. It does not, because it treats selling time as one pool. It multiplies total hours by the selling share and calls the result capacity. Research sits on both sides of that line depending on who you ask: some teams count it as selling, some count it as admin, and nobody counts minutes per account. The model ends up with hours but no idea how many accounts those hours can move.
What breaks when the number is wrong
Suppose research actually takes 25 minutes per account, not 15. The rep still has the same two and a quarter hours. That buys about 5 accounts a day, around 1,200 a year instead of 2,000. At the same conversion rates that is 180 first meetings, 72 opportunities and 18 closed deals: $540,000, or 60% of quota. The capacity model still shows this rep at full capacity, because none of its rows moved.
In practice the rep does not let volume fall that quietly. They do one of three things, and each one shows up somewhere else on the dashboard:
| What the rep does | What the model shows | What actually happened |
|---|---|---|
| Keeps volume, thins the research | Activity on target, meeting rate falls | The conversion rate the plan used was earned on deeper research. Generic outreach converts worse, so the funnel shrinks from the top. |
| Keeps depth, cuts volume | Activity below target, coaching conversation about effort | Coverage shrinks. Part of the territory is never approached, but the plan counted its potential as reachable. |
| Works the familiar accounts | Pipeline concentrated in a few names | The rep recycles accounts already researched. Whitespace in the rest of the book goes untouched. |
All three get diagnosed as something else. The first looks like a messaging problem. The second looks like a motivation problem. The third looks like a territory problem, and prompts a redraw of the territory plan that does nothing about the hours.
Ramp is partly research ramp
The same assumption distorts the ramp row. Pigment cites The Bridge Group's finding that average ramp is just over three months, and the models above use anywhere from three to seven. Much of that ramp is a new rep learning to research: which sources matter for this product, what a real reason to call looks like, what to ignore. A new hire might take 40 minutes per account in month one and 20 by month four. If the plan models ramp as a percentage of quota without modelling research speed, it cannot tell you whether a rep who is behind is slow at selling or slow at finding who to sell to. The fix for each is different.
How to measure research throughput
You do not need new software to put a number on this. You need a two-week sample and some honesty about what counts as research.
- Define a researched account. Write down what a rep must know before approaching: for example, a current event at the account, the product of yours it relates to, and the source. If your team already uses a pre-call research checklist, that is the definition.
- Time it. Ask three reps at different tenures to log start and end times for every account they research over two weeks. Take the median per rep, not the mean, because a few deep dives will skew it.
- Count accounts, not activities. Accounts researched per week is the throughput number. Emails and dials sent per week are not, because one researched account can produce a dozen touches.
- Split conversion by research depth. Compare first-meeting rates on accounts that met the definition in step one against accounts that did not. This tells you what the plan's conversion rate is actually conditional on.
- Add the row. Put accounts researched per rep per week into the capacity model, next to headcount and ramp, and compute the accounts the funnel needs. If required is larger than available, you have found the gap before the quarter finds it for you.
Once the row exists, it becomes a lever the plan can move, the same way hiring and ramp are levers.
Ways to raise the ceiling
When required research throughput exceeds what the team has, there are four ways to close the gap. They have very different costs.
| Lever | How it works | Cost and catch |
|---|---|---|
| Hire more reps | More hours, so more accounts researched | The most expensive option, and each new hire starts slow at research during ramp. |
| Tier the accounts | Deep research on the top tier, light touch on the rest | Cheap and usually right, but the light tier converts at a lower rate. Model it at that lower rate, not the blended one. |
| Centralize research | An SDR, analyst or RevOps desk prepares accounts for AEs | Moves the hours rather than removing them. Works when the researchers know what each account executive sells. |
| Automate the first pass | Software reads each account and returns what it found, the rep reviews | Only useful if the output is specific to what you sell and shows its sources. Generic firmographics do not replace the reason to call. |
The last lever is the one PitchSmart is built for. It reads every account on your list against the products you sell, checks the buying signals you define for each product, and returns the ones that hold, each with its source. The rep's job moves from researching 9 accounts a day from scratch to reviewing findings across the whole list and deciding which ones are worth a call this week. That changes the research row of the capacity model directly, because minutes per account drop to review time.
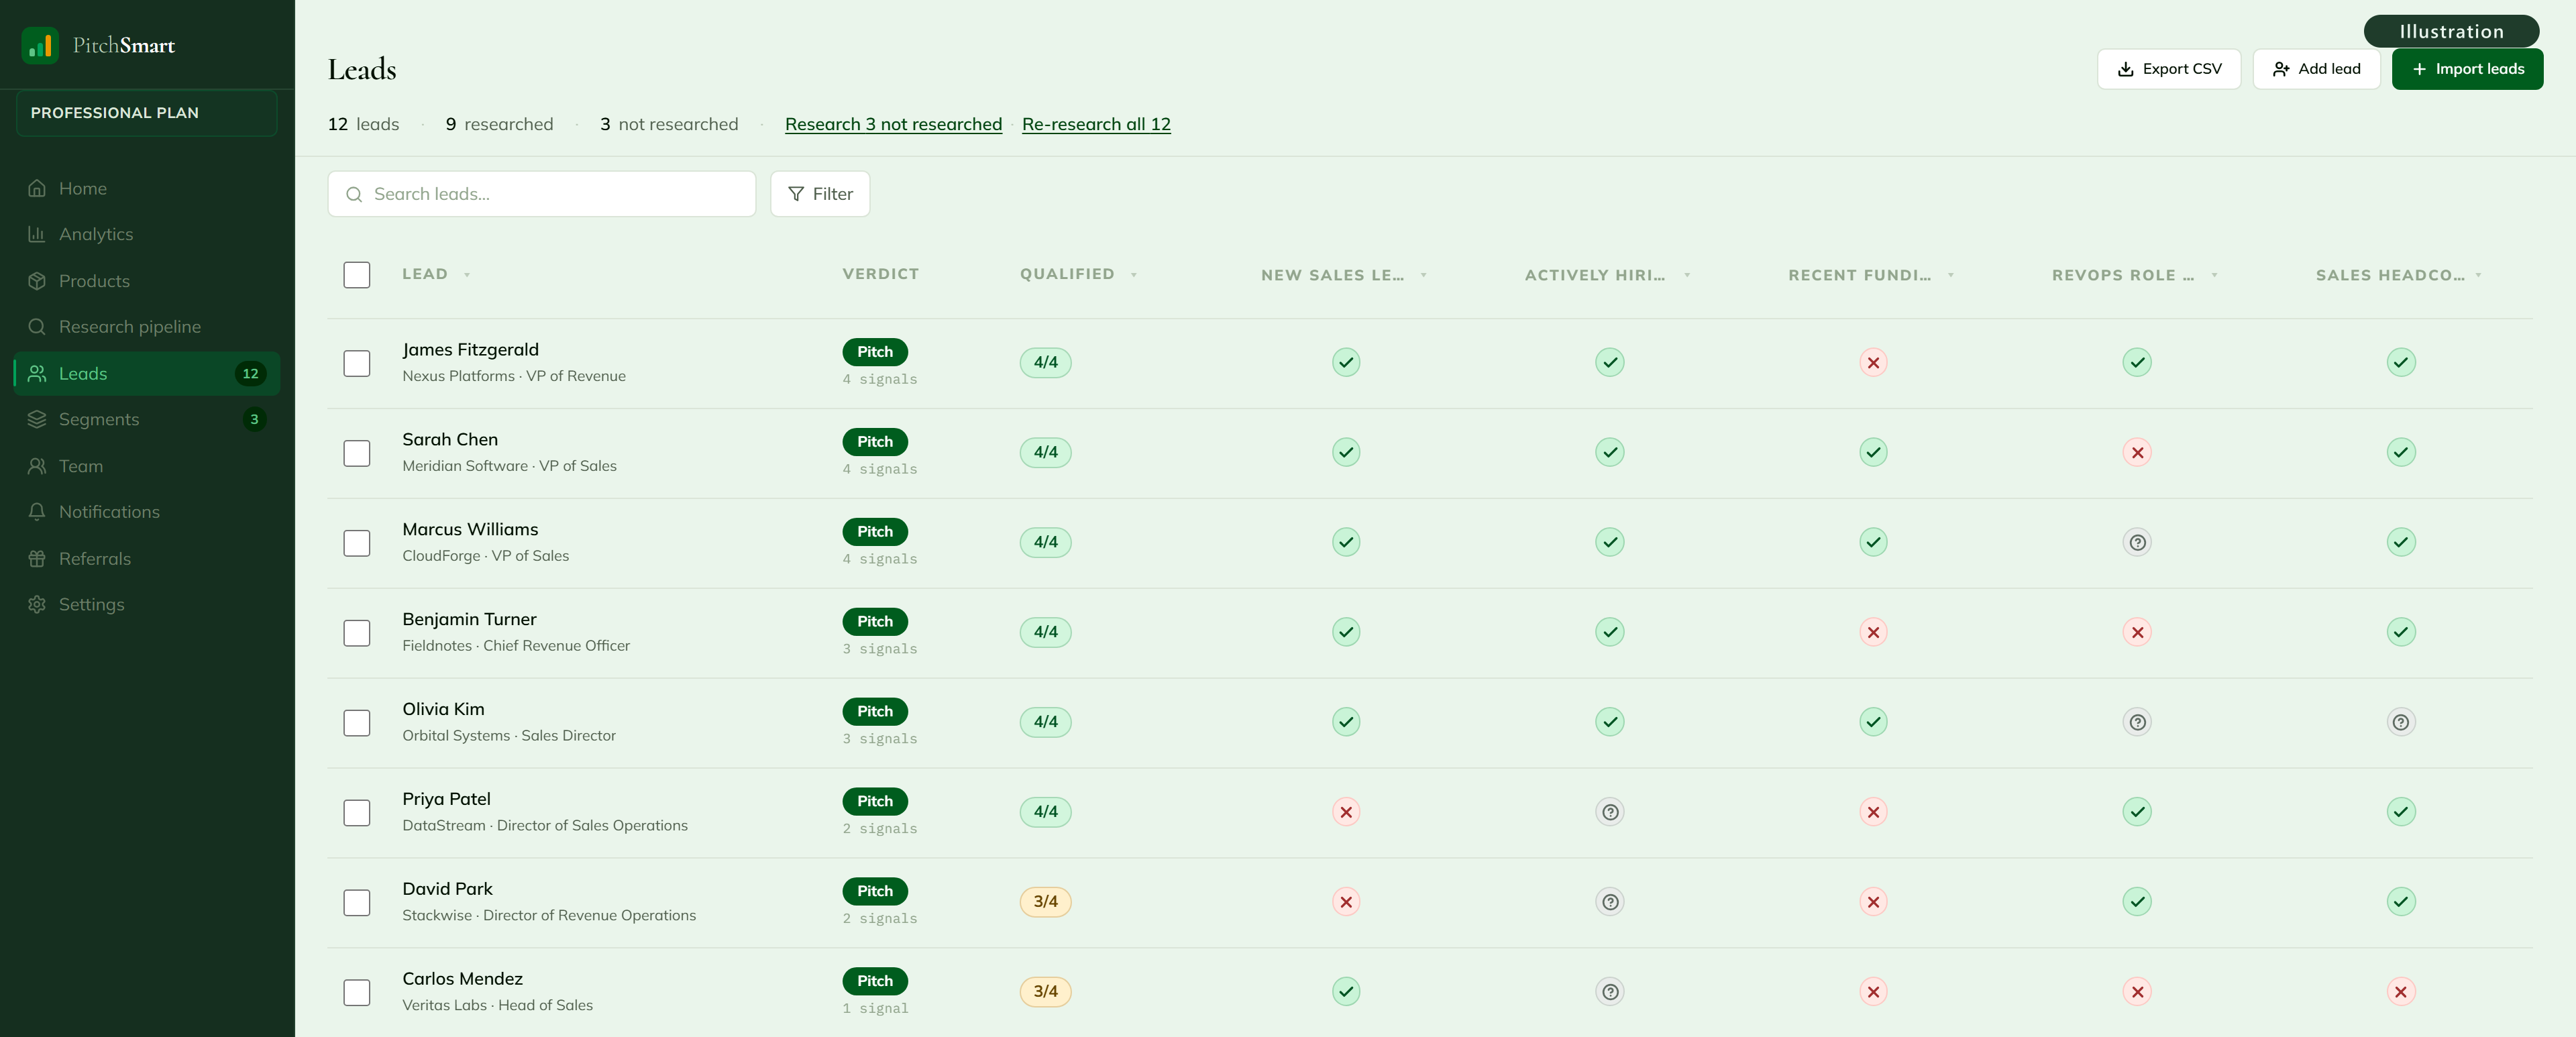
Illustration from a PitchSmart demo account. Every company and person shown is invented. Each column is one buying signal for one product, checked against every account on the list, so a rep starts the day with the accounts that already carry a reason to call. If you want to see how it would change your own research row, start a free trial and run it on a slice of one territory.
Whatever lever you pick, the discipline is the same one described in the account research process guide: decide what a finished piece of research contains, so you can count it.
A capacity model with the line added
Here is what the per-rep block of the plan looks like once research throughput is an explicit input. The figures continue the illustrative example above.
| Row | Value | Source |
|---|---|---|
| Annual quota | $900,000 | Plan |
| Average deal size | $30,000 | CRM, trailing four quarters |
| Opportunity win rate | 1 in 4 | CRM |
| Meeting to opportunity | 2 in 5 | CRM |
| Researched account to meeting | 15 in 100 | Two-week sample, researched accounts only |
| Accounts required per week | 43 | Calculated |
| Minutes per researched account | 25 | Two-week timing sample, median |
| Research hours available per day | 2.25 | Time study |
| Accounts available per week | 27 | Calculated |
| Throughput gap | 16 accounts per week | Required minus available |
That final row is the finding. The rep in this example is not under-performing. The plan asked for 43 researched accounts a week from someone who has time for 27, and it hid the request inside a conversion rate. Put the row on the sheet and the conversation changes from "why are you behind" to "which lever closes 16 accounts a week."
Two more links are worth following from here. If your forecast is built on the same capacity numbers, the guide to sales forecasts explains how a missing input upstream becomes a miss downstream. And if you are deciding what a rep should be looking for when they research, start with buying signals in sales: the signals are the definition of a researched account, and the definition is what makes the throughput number countable.